

In today’s world of software development, many organizations develop and maintain a large number of applications running on cloud platforms like Azure. It is crucial to have an efficient mechanism for collecting and analyzing the performance and status data of these applications. In this blog, we will explore the generic Telemetry capturing for software applications in Azure and visualize the data in the Grafana dashboard tool.
Applications Telemetry in Azure for Business
How Does Telemetry Help Improve the Supply Chain of Application Development and Operations?
What is Telemetry?
Telemetry automatically collects, transmits, and measures data from applications, using a special framework to collect data. The data collected from applications is analyzed to monitor and control the health status of applications and services. Additionally, Telemetry allows us to track anomalies in an application’s day-to-day work and set up appropriate actions. In short, Telemetry is a tool that gives control for unpredictable cases in Supply Chain.
Cloud solutions provide such important features as Analytics, which help to demonstrate how applications work, such as health status, CPU, memory, network consumption, etc. Moreover, we can get data from Application UI to track user experience and get a view of how the application is used, if it is well-structured and has a clear interface, that will protect the users from confusion. Telemetry produces data that can be analyzed and controlled; this is where leveraging Grafana for real-time monitoring and analytics in Telemetry is useful.
Azure offers various services for collecting application Telemetry. One key tool is Application Insights. It enables tracking and analyzing various aspects of application performance, such as Database Queries, Memory Usage, Response Time, and Errors.
Application Insights can be easily integrated with multiple platforms and programming languages, allowing Telemetry data collection from various applications running on Azure. It has libraries for languages such as .NET, Java, Node.js, Python, and others.
Application Insights can also capture the usage behavior and user actions. The data includes Requests, Exceptions, Events, and Performance metrics of the application. The collected data is stored in the Azure data store.
Our team has developed a custom solution for collecting Telemetry data from the user interface of web applications. Implementing a scalable and flexible Telemetry infrastructure with Grafana, we aspire to offer a fool-proof solution.
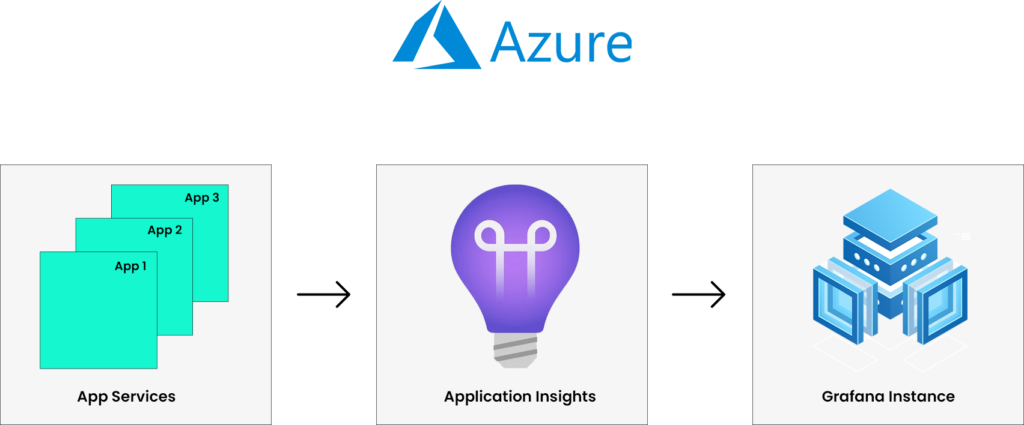
General Architecture of the Solution
Challenges Overcame
To improve the application’s usability and user experience, we worked on creating a customizable Telemetry dashboard with Grafana.
The main challenges in developing the solution were,
- It was necessary to study the workflows of each application and collect the core business requirements to understand each of the application’s workflow. We need to simplify and generalize the approach that caters to building suitable metrics and come up with a worthy solution.
- Figure out what metrics would be most informative for visualization of the data.
- Put together common graphs to unify the solution and dashboards for visualization.
- Develop a standard set of metrics and visualizations relevant to any application.
- We worked with customers for clarifications of queries.
The result of the solution is a generic SDK with a set of recommendations that can be adopted for all the projects of the Customer seamlessly.
We worked on the next step to visualize the solution.
Visualization of Telemetry Data with Grafana
Various tools and platforms can be used to visualize and analyze Telemetry data. After evaluating the capabilities of several solutions, we decided on visualizing telemetry data using Grafana dashboards.
Grafana is a powerful platform for data visualization to create intuitive graphs and charts. It supports writing custom queries to build graphs and charts using KQL (Kusto Query Language) from Azure. Using KQL it is possible to create informative dashboards.
One of the most important advantages of Grafana is that it supports automation of dashboard creation, loading dashboards into Grafana instance. I should also mention that Grafana provides sufficient features set for free.
Grafana can be easily integrated with Azure, allowing you to visualize application Telemetry data collected by Application Insights. This requires setting up a data source in Grafana that will use the Application Insights API to retrieve the data.
Once the data source is configured, you can create dashboards that display various graphs and charts that represent Telemetry data. For example, you can create graphs showing the number of requests to the application at a particular time, the average response time, or the number of errors.
Conclusion:
Increased application visibility helps improve predictability in Supply Chain
Generic applications Telemetry and the Grafana dashboard provide the ability to collect, visualize, and analyze the performance and status data of applications. This enables efficient monitoring of application operations and identification of issues. Such an informative approach gives a good platform to take necessary actions on issues resolving. Azure and Grafana offer a powerful solution for monitoring and managing applications in the cloud environment. We believe that monitoring day-to-day tasks can become easier by using Grafana to visualize Azure-related data.